

When an event wraps up, organizers need more than attendance numbers. They need to tell the story of what happened, who participated, and how their efforts made an impact.
Proxi makes that process fast and accurate. Every interactive map automatically captures analytics like views, engagement, and check ins, so your recap is ready the moment your event ends. With everything downloadable, you can build custom report outs in minutes using real data.
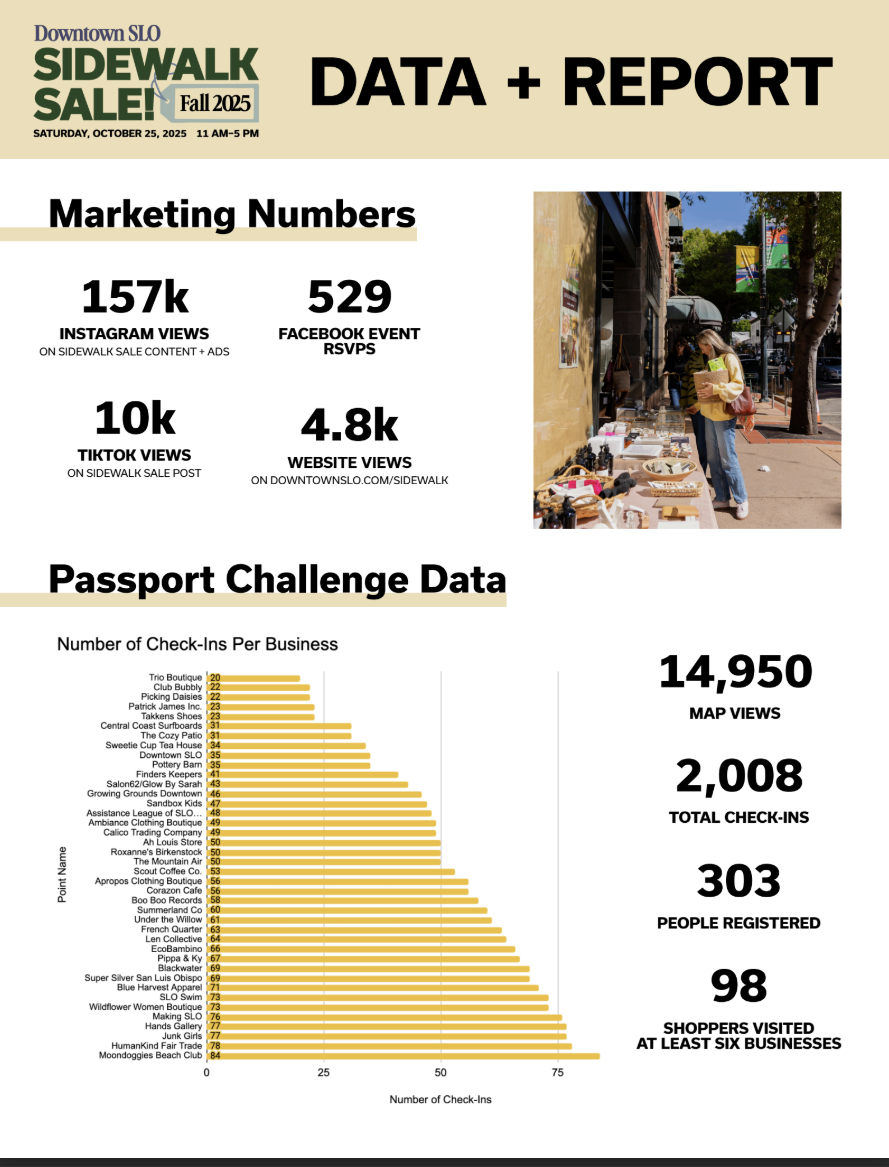
Let’s look at how Downtown SLO used Proxi analytics to showcase the results of their Sidewalk Sale Passport Challenge.
From Map to Metrics: Downtown SLO’s Sidewalk Sale
Downtown SLO hosted a sidewalk sale to encourage locals to visit shops and explore downtown businesses. Using a Proxi Passport Challenge, shoppers registered, checked in at participating stores, and tracked their progress right on the map.
When the event ended, Downtown SLO had all the metrics they needed to measure impact and share results with partners and sponsors.
Key Results
- 2,008 total check ins
- 303 registered participants
- 98 shoppers visited six or more businesses
- 14,950 map views
- 157,000 Instagram views
- 10,000 TikTok views
- 529 Facebook RSVPs
- 4,800 website views
Those numbers told a powerful story of community engagement and local business participation.
The Data You Get in Every Proxi Map
With Proxi, every map automatically collects detailed analytics that help you understand performance and impact. Organizers can view:
- Total and unique map views
- Average time on map
- Views over time to identify engagement trends
- Geographic data showing where visitors are coming from
- Click data for every location
- Detailed check in data including time, user, and location
All of this information is downloadable, making it simple to create your own branded report outs, presentations, or grant reports.
Whether you are running a holiday passport, scavenger hunt, or community voting contest, your data is organized, exportable, and ready when you need it.
Why Event Analytics Matter
Strong event analytics turn engagement into evidence. With Proxi’s data, you can:
- Show sponsors exactly how many people engaged and where
- Share economic impact with chambers, downtown associations, and tourism boards
- Give business owners insights into which locations and promotions performed best
- Use verified data to strengthen grant applications and post event reports
Having this data ready saves hours of manual tracking and helps your organization build credibility with every event.
Build Smarter Report Outs, Faster
With Proxi, you can skip the spreadsheets and guesswork. Download engagement data instantly, customize visuals, and share clear, professional report outs that make your event results easy to understand.
Downtown SLO’s team went from event day to final report without wasting time collecting numbers across multiple platforms. Their Proxi dashboard provided all the proof points they needed.
Measure What Matters
Every map tells a story. With Proxi, you can see exactly how your audience explored, checked in, and connected. Use that insight to celebrate wins, improve future events, and demonstrate measurable community impact.
👉 Create a map at Proxi.co and see how easy it is to turn engagement into results.
Adventure Awaits!
Check out some of the latest articles on our blog